Mobile Phone Pricing Index Drop Trend Smooths with a 0.7% Decline in Global Average Advertised Pricing, According to IDC’s Mobile Phone Pricing Index
NEEDHAM, Mass., February 27, 2024 – The International Data Corporation (IDC) has unveiled its latest analysis of mobile phone pricing, revealing a return to a downward trend in average advertised prices globally. From February 2024 to February 2025, IDC noted that average pricing declined by 0.7% globally, showing some improvement from the 0.8% decline observed last month.
Over the past six months, the pricing trend has exhibited negative growth after the 0.4% increase in August 2024. Starting from September last year, the monthly average pricing decreased by 0.1%, then dropped further to 2.6% in November, marking the highest drop in the past 12 months. The decline moderated after November but continued with a 1.7% decrease in December, followed by a recent 0.7% decline in the February of 2025.
Regionally, while the global average reflects a downturn, all regions are experiencing declines as well. Japan saw the largest drop at 1.6%, followed by USA and Latin America with the drop of 1.0% and 1.5% respectively. APeJC, Middle East and Africa, Central and Eastern Europe and Western Europe saw slight declines below 0.8%. Canada and PRC showed the least decline at 0.3% and 0.1%, respectively.
Among the top five brands—Apple, Samsung, Xiaomi, Huawei, and Motorola—all reported a decrease in their average advertised pricing compared to the previous month. Samsung, Apple and Xiaomi experienced higher declines at 1.1%, 0.9%, and 0.7%, respectively, while Huawei and Motorola saw smaller changes at -0.4% and -0.04%.
IDC PWI Growth vs Baseline – by Region
| Date | APeJC | Canada | CEE | Japan | LA | MEA | PRC | USA | WE |
|---|---|---|---|---|---|---|---|---|---|
| 2024 January | -1.4% | -1.7% | -0.9% | -1.6% | 0.6% | -0.3% | -0.6% | -0.5% | -0.6% |
| 2024 February | -0.7% | -0.4% | -1.7% | -2.5% | -1.0% | 1.0% | -0.3% | -0.4% | -1.6% |
| 2024 March | -1.6% | -1.0% | -1.5% | -1.4% | -0.2% | -4.5% | -0.5% | -0.1% | -2.0% |
| 2024 April | -1.2% | -1.7% | -1.1% | -2.3% | -1.1% | -1.2% | 3.2% | -2.0% | -1.7% |
| 2024 May | -1.0% | -0.7% | -0.6% | -1.1% | -0.5% | -0.3% | -3.0% | -0.3% | -0.7% |
| 2024 June | -1.1% | -0.1% | -1.1% | -2.3% | -2.6% | -1.4% | 2.3% | -1.5% | -0.3% |
| 2024 July | 0.6% | 0.2% | -0.6% | 0.2% | -0.7% | -0.2% | -2.6% | 0.4% | -0.8% |
| 2024 August | 1.8% | -0.5% | -0.0% | 2.7% | -1.2% | -0.7% | 3.0% | -1.7% | 1.0% |
| 2024 September | 0.8% | 0.2% | -0.7% | 1.1% | -0.9% | -0.0% | -0.9% | 0.2% | 0.5% |
| 2024 October | -2.9% | -2.4% | -1.6% | -3.7% | -2.0% | -0.1% | 0.8% | -4.0% | -1.4% |
| 2024 November | -1.7% | -2.9% | -2.9% | -1.9% | -1.1% | -1.0% | -1.0% | -0.2% | -3.3% |
| 2024 December | -1.9% | -2.0% | -1.6% | -0.8% | -0.5% | -0.9% | -0.8% | -4.0% | -2.1% |
| 2025 January | -1.0% | -1.7% | -1.1% | -1.3% | -0.6% | -0.5% | -0.8% | 0.3% | -1.1% |
| 2025 February | -0.7% | -0.3% | -0.8% | -1.6% | -1.5% | -0.5% | -0.1% | -1.0% | -0.7% |

IDC PWI Growth from Base – By Top Brands
Data table for “IDC PWI Growth from Base – By Top Brands” chart Index Growth %
| Date | Apple | Huawei | Motorola | Samsung | Xiaomi |
|---|---|---|---|---|---|
| 2024 January | -0.2% | -0.5% | -0.3% | -0.3% | -0.2% |
| 2024 February | -1.5% | 0.1% | -1.7% | -1.2% | -1.6% |
| 2024 March | -1.3% | -2.2% | -0.1% | -1.6% | -1.5% |
| 2024 April | -0.8% | -1.3% | -1.6% | -1.6% | -1.3% |
| 2024 May | -0.4% | -0.6% | -0.4% | -0.4% | -0.8% |
| 2024 June | -0.8% | -0.8% | -0.6% | -0.8% | -0.3% |
| 2024 July | 0.0% | -0.7% | -1.0% | -0.6% | -0.9% |
| 2024 August | 0.5% | 0.9% | 0.4% | 0.2% | 0.1% |
| 2024 September | 0.0% | -0.3% | -0.2% | 0.1% | 0.3% |
| 2024 October | -1.6% | -0.6% | -1.2% | -1.0% | -1.1% |
| 2024 November | -1.7% | -2.5% | -1.5% | -1.8% | -2.1% |
| 2024 December | -1.1% | -1.6% | -1.8% | -1.4% | -1.7% |
| 2025 January | -1.1% | -0.4% | -0.8% | -0.0% | 0.3% |
| 2025 February | -0.9% | -0.4% | -0.0% | -1.1% | -0.7% |

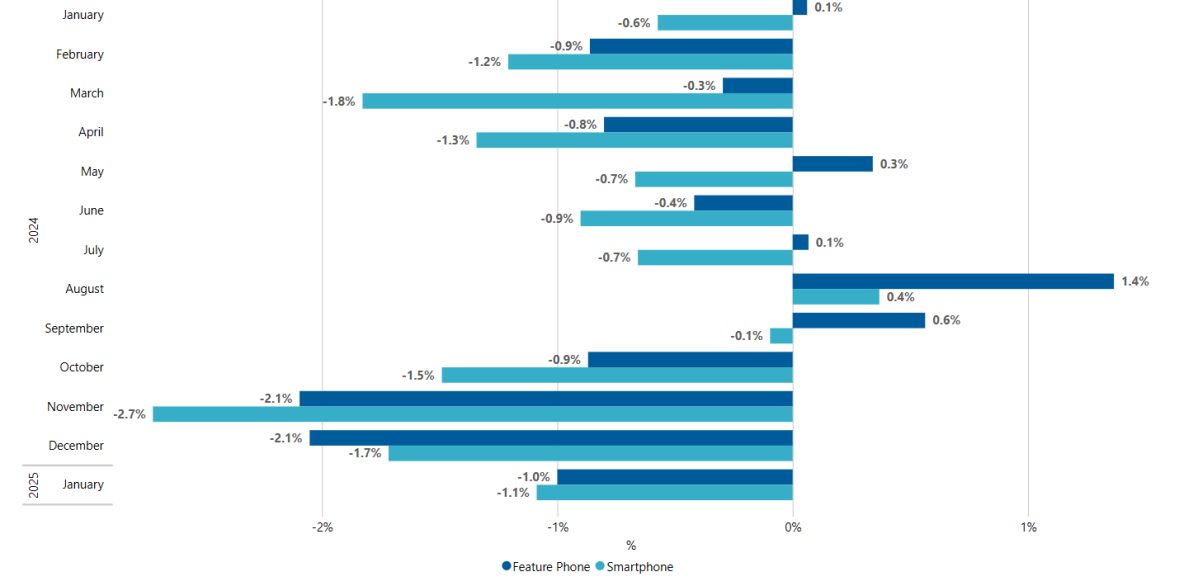
IDC PWI Growth from Base – By Product Category
Data table for “IDC PWI Growth from Base – By Product Category” chart Index Growth %
| Date | Feature Phone | Smartphone |
|---|---|---|
| 2024 January | 0.1% | -0.6% |
| 2024 February | -0.9% | -1.3% |
| 2024 March | -0.4% | -1.9% |
| 2024 April | -0.8% | -1.4% |
| 2024 May | 0.3% | -0.7% |
| 2024 June | -0.4% | -0.9% |
| 2024 July | 0.1% | -0.7% |
| 2024 August | 1.4% | 0.4% |
| 2024 September | 0.5% | -0.1% |
| 2024 October | -1.0% | -1.6% |
| 2024 November | -2.1% | -2.7% |
| 2024 December | -2.1% | -1.8% |
| 2025 January | -0.5% | -0.8% |
| 2025 February | -0.1% | -0.7% |
IDC Pricing Watch products provide detailed monthly updates on advertised pricing that support product, channel, and go-to-market management.
IDC’s Mobile Phone Pricing Watch gathers data in nearly 80 countries and provides detailed, timely, and accurate information on Mobile Phone device pricing using a Pricing Index among other analysis. The Pricing Watch covers the core technology dimensions in IDC’s market leading Quarterly Mobile Phone Tracker – plus additional details on channels and other dimensions in monthly updates. The Pricing Watch is a valuable resource for strategic pricing and operations in the Mobile Phone market globally. For more information, or to subscribe to the research, please contact Kathy Nagamine at 650-350-6423 or knagamine@idc.com.


